



While it might be predictable, we think the market continues to overreact to hot CPI readings, which makes the related selloff in REITs a great buying opportunity.
In what follows, we will dig into the latest CPI report for September 2026, showing that inflation remains contained to the energy category.
And then we will consider three major disinflationary forces exerting pressure in the opposite direction right now.
September CPI Shows More of The Same
The narrative about inflation that moves the market and drives interest rates appears to be remarkably simplistic.
The idea is that higher oil prices, and especially stubbornly high diesel prices, are pushing up the CPI, and a higher CPI rate is pushing up interest rates.
Higher interest rates, in turn, have caused a sharp selloff in rate-sensitive stocks such as REITs (VNQ).
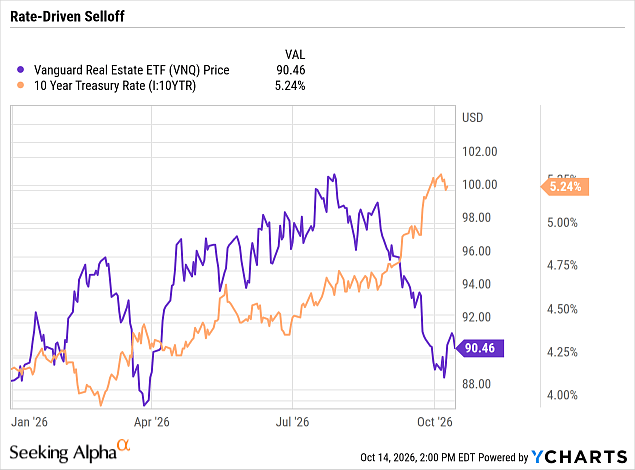
But we think the recent inflationary surge is a lot less daunting or threatening than the market reaction would indicate.
As we argued in our last inflation report, this inflationary surge has been and remains overwhelmingly oil-driven.
The most recent CPI report for September 2026 did not change that. As you can see in this chart, the energy component of the CPI soared 20% year-over-year, pulling up headline CPI to 3.7%.
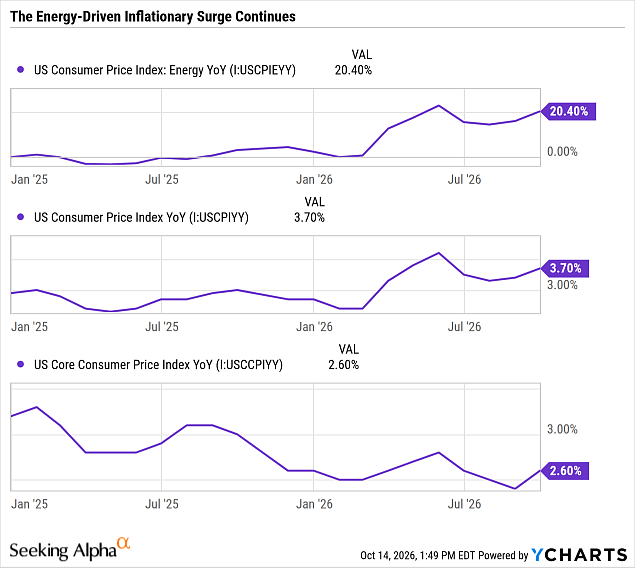
Meanwhile, core CPI also bounced off its recent low to 2.6%, which has caused some to worry that higher fuel costs are already translating into price increases for other items across the economy.
We disagree with that read of the situation.
While this may not be true for the rest of the world, the US has so far seen little to no translation of higher fuel costs into higher prices of other goods and services (aside from directly impacted industries like airlines). Instead, most of the September uptick in core CPI came from a mysterious bump in owners’ equivalent rent, a notoriously quirky component of the CPI that makes up ~26% of the headline index and ~32% of the core index.
The major categories of Food, Goods (ex. food & energy), and Shelter all remain stable or in disinflationary trajectories.
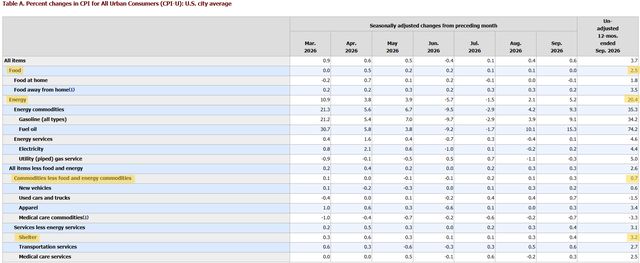
(Click on the image to enlarge on your screen.)
Together, Food (13.5%), Non-food/energy goods (18.8%), and shelter (35.3%) account for roughly two-thirds (67.6%) of the CPI basket.
Energy items account for only 7.4% of the overall index but are the primary driver of its upward trajectory right now.
Airfares, which make up 1.0% of the CPI basket, also surged 22% YoY in September, but they are overwhelmingly based on energy prices.
While electricity prices are rising because of the AI-driven growth in demand for power, we would emphasize that prices for non-energy services, groceries, and non-food/energy goods all remain under control.
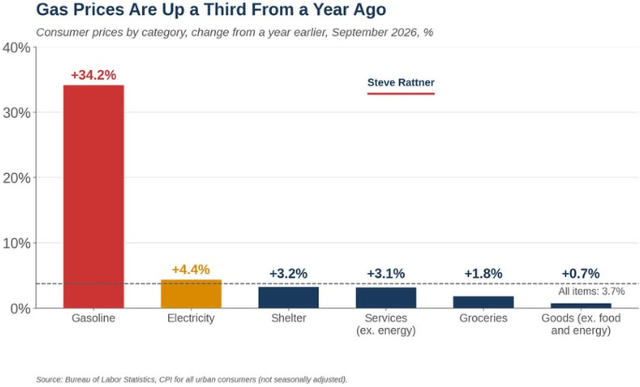
Steve Rattner
Note that the majority of non-energy services are shelter metrics. The non-shelter categories within non-energy services show even lower levels of price growth than shelter.
Medical care services showed a YoY increase of 2.5% in September, while transportation services showed only a 2.7% YoY increase, even including a 22% jump in airfares!
To be fair, fruits and vegetables are one category where we have seen higher diesel costs impact prices. There has been a distinct increase in fruits & vegetables prices in the wake of the Iran conflict. But fruits & vegetables prices fluctuate significantly and sometimes drop, unlike many other types of goods where prices only ever go up.
The food category overall is not seeing a rising rate of price growth. Instead, since sometime over the summer, the food category of the CPI appears to have returned to a disinflationary trend.
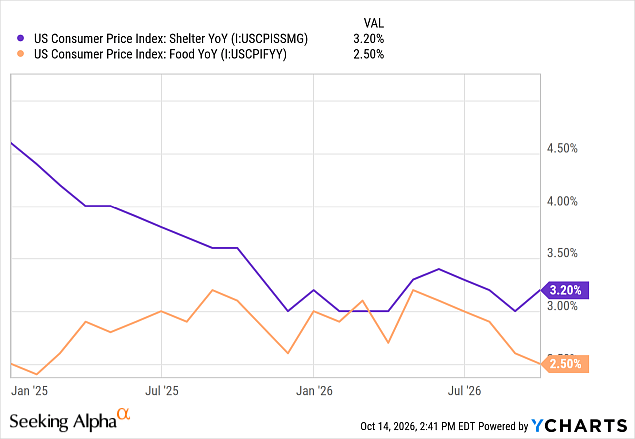
Shelter was an outlier outside the energy category in September, bouncing from the previous month’s 3% rate up to 3.2%.
What is going on with housing?

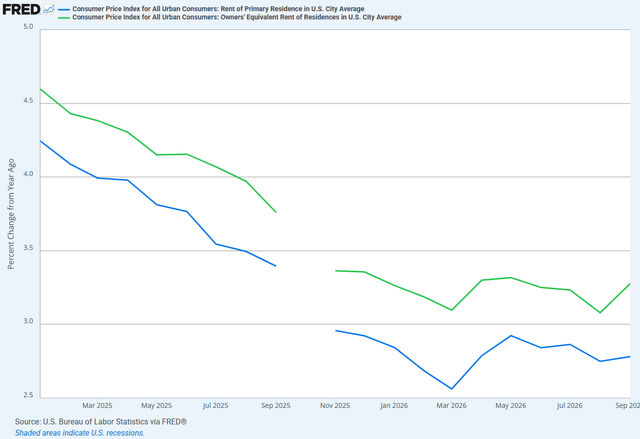
By virtually all available data, we can safely conclude that the cause of the uptick was not rent rates. Apartment List shows -0.1% month-over-month and -0.4% year-over-year rent changes for the month of September. New lease rents should still be exerting downward pressure on the CPI’s “Rent of Primary Residence” item.
Instead, virtually all of the shelter component’s September bump came from the “Owners’ Equivalent Rent” item.
Rent of Primary Residence (Blue) & Owners’ Equivalent Rent (Green) YoY:
We won’t rehash all of our reasons for thinking the OER is a poor way to measure housing inflation, but suffice it to say that the metric is based on surveys of homeowners performed every 6 months. Homeowners are asked how much they think their home would rent for (not including utilities).
After some adjustments, this survey data becomes the final OER number.
But since most homeowners don’t participate in the rental market, their rent estimates tend to be derived from a combination of local market rent rates and broader economic sentiment.
If, say, broader sentiment is that inflation is high, then survey respondents may inflate their homes’ estimated rent rates. We think that is probably the main reason for the September bump in the OER.
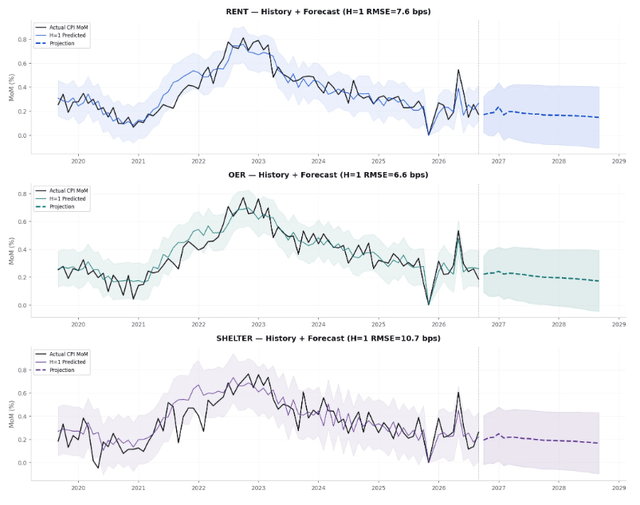
While we can’t predict where OER will fall in the pre-Midterm month of October (after all, there’s lots of politically motivated media buzz about inflation and affordability right now), we do think the shelter component of the CPI remains in a disinflationary trend.
Zillow forecasts this gradual disinflationary trend to last for at least the next two years:
The plain fact of the matter as it relates to housing is that US population growth is now extremely low, while new single-family and multifamily housing continues to be built, albeit at a significantly slower pace than its post-pandemic peak.
That presents a headwind to organic growth for residential REITs (who have other ways of growing besides rent increases), but it is a major disinflationary force within the CPI.
