


Our thesis that the CPI will trend lower over the remainder of 2026 is playing out nicely.
We have been making the argument for several months that the recent inflationary bounce is a temporary phenomenon driven by the Iran conflict. The oil supply disruption caused an overwhelmingly energy-driven bump in the CPI, but as the conflict wound down, inflation would cool.
In the medium- to long-run, tame money supply growth, a sluggish non-AI economy, stagnant labor market, weak housing market, Sunbelt apartment oversupply, stabilizing trade policy, and weakening paycheck-to-paycheck consumer will continue to pull inflation down.
The cooler-than-expected June 2026 CPI report lends support to that thesis, as we’ll show below.
The biggest threat to this thesis is a re-escalation of the Iran conflict resulting in a prolonged closure of the Strait of Hormuz.
This vital shipping waterway was choked off for three and a half months, from March through mid-June, although some ships did manage to make the transit by switching off transponders (”going dark”).
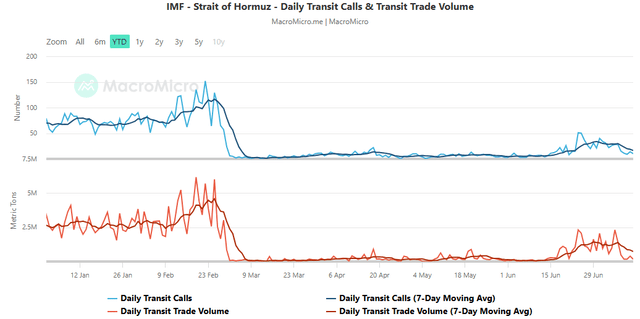
After the US and Iran reached a memorandum of understanding in June, traffic through the strait began to pick back up again.
Then the conflict resumed, becoming kinetic again.
Here’s the critical risk.
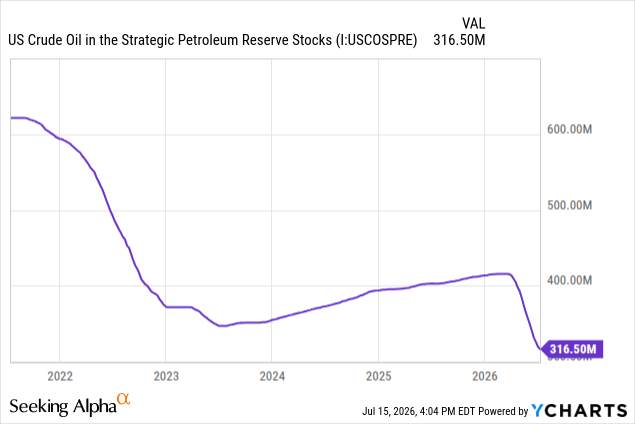
During the first several months of this conflict, oil prices were kept in check by a rapid release of US petroleum reserves -- even faster than the release in 2022 in the wake of the Russian invasion of Ukraine.
Also, China tapped into its vast petroleum reserves in order to limit its demand for imports.
But now, US reserves have reached critically low levels that won’t allow further withdrawals without risking the integrity of the salt caverns. And while China likely still has ample reserves, their primary benefit will go to the people of China.
The risk, in short, is that oil flows out of the Strait of Hormuz are once again cut off for a sustained period without the cushion of reserve releases to blunt the impact. That could cause oil prices to surge again, keeping inflation and interest rates elevated.
Already, since the MoU fell apart and hostilities resumed, the price of oil has been climbing steadily.
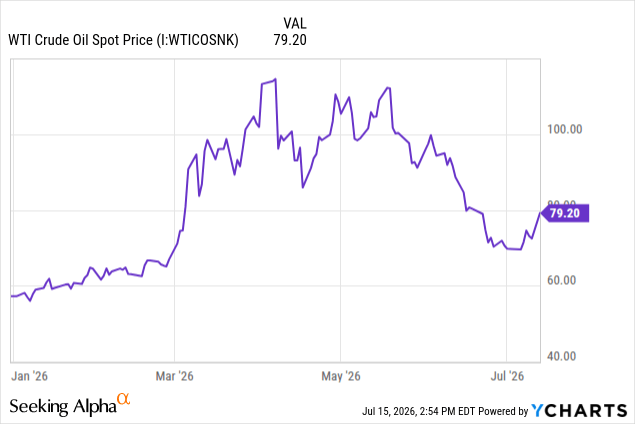
The risk of an oil-driven stagflation for a while longer is by no means out of the question.
We are not geopolitical analysts, but we do think that despite President Trump’s desire to neatly conclude the conflict as quickly as possible, the Iranians probably have the ability to sustain hostilities for quite a while, if they choose to do so.
But there’s some good news that drastically minimizes this risk to the US economy.
Over time, the oil intensity of real GDP (how much oil it takes to produce a unit of GDP) has fallen dramatically. If you expand that out to the intensity of all energy, the US economy has been getting less and less energy-intensive over time.
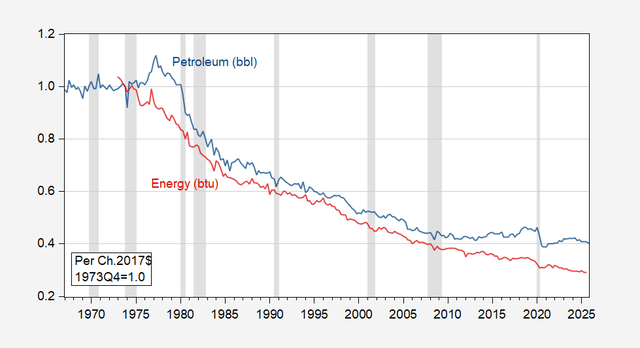
In such an environment, oil prices simply don’t matter that much to the overall US economy.
In fact, according to recent analysis put out by the Yale Budget Lab, since the beginning of fracking, a $10 rise in the price of a barrel of oil has only a very minor negative impact on real GDP over the next year and a negligible effect thereafter.
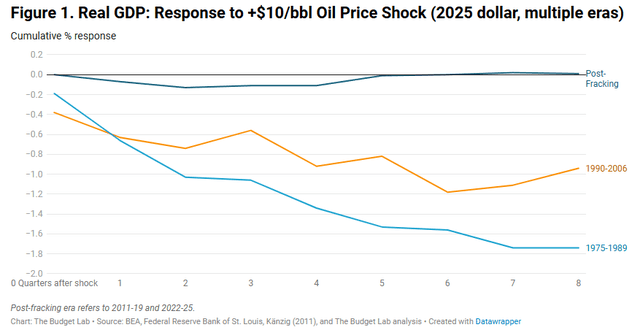
That is very different from previous eras.
As you can see, during the “Great Inflation” era of the 1970s, a spike in oil prices had a far more severe and long-lasting negative impact on real GDP.
Even in the 1990s and 2000s, the US economy remained quite sensitive to oil prices, albeit less so than in the ‘70s and ‘80s.
So, while a sharp but temporary spike in oil prices would surely raise inflation and interest rates, it would not likely be enough to send the US economy into recession. Moreover, the Yale Budget Lab found that a spike in oil prices had a relatively muted effect on core CPI, and that effect is spread out over multiple years.
That brings us to the June CPI and PPI reports released recently.
During the three months from March through May, both the consumer price index and producer price index surged on the back of oil prices, while core CPI edged higher only slightly.
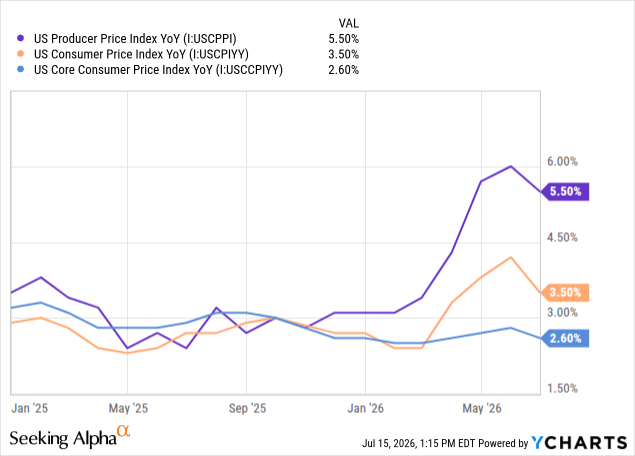
But as you can see, all three retreated in June.
As we explained in last month’s inflation update article, the spike in the CPI was overwhelmingly driven by oil prices. But the core CPI, which strips out food and energy, rose primarily because of a quirk in the shelter metrics. The government shutdown last Fall caused a gap that resulted in artificially high shelter component readings in April and May.
Owners’ Equivalent Rent (Blue) & Rent of Primary Residence (Green) YoY:
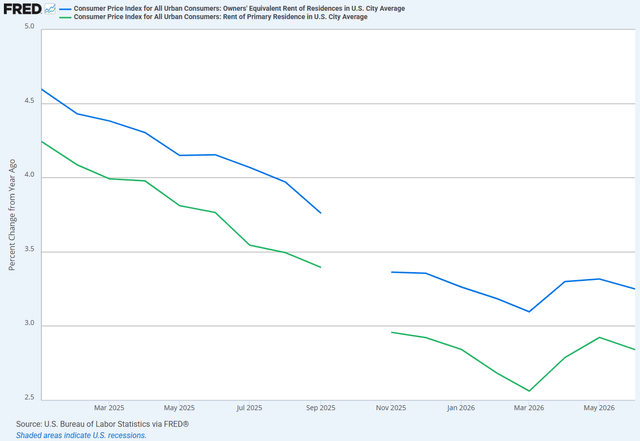

We predicted last month that shelter CPI would come down in future months, and so far that prediction has been accurate.
Private sector aggregators of rent rates like Apartment List continue to show a soft multifamily market, albeit one that is past the worst of the oversupply headwinds. Rents should remain flat for a while longer, until the national average vacancy rate comes down further.
As such, the CPI’s shelter metrics, which lag real-time market rent rates by a year or more, should almost certainly continue their disinflationary path going forward.
Here’s an overview of the June CPI report, with three particularly important components highlighted:
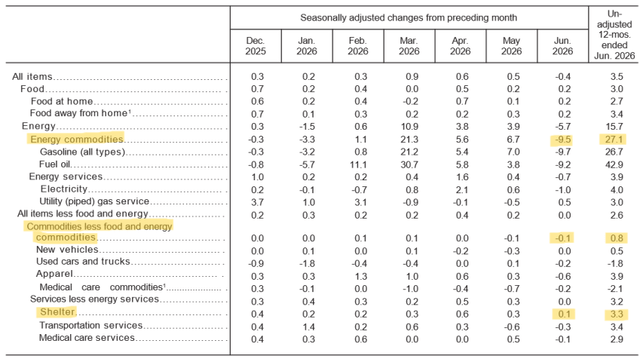
Perhaps surprisingly, the overall index fell 0.4% month-over-month, driven primarily by the drop in oil prices but also by MoM declines in electricity, used cars, electricity, transportation services, and medical care.
It appears that higher gasoline prices caused some consumers to pull back on other forms of spending, which then led to price declines in those areas.
Notice, for example, that the large category of “commodities less food and energy,” which makes up ~19% of the CPI, has fallen 0.1% MoM for two consecutive months now.
All Goods Excluding Food & Energy YoY:
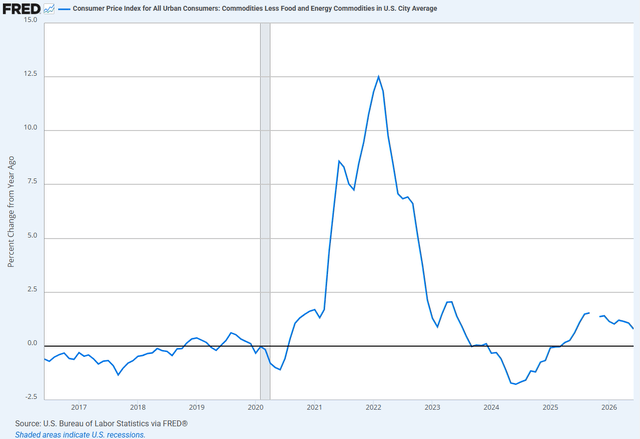
It appears that after the inflationary surge in this category following the “Liberation Day” tariffs, price growth is now veering back toward the zero line.
With wage growth fairly low and lower-income consumers fragile, many Americans lack the financial capacity to absorb higher gasoline prices without sacrificing other forms of consumption.
This is true also of the middle class, who tend to be the primary customers of airlines. Airline fares spiked in the wake of the Iran conflict and remained high in June.
Airline Fares Index:
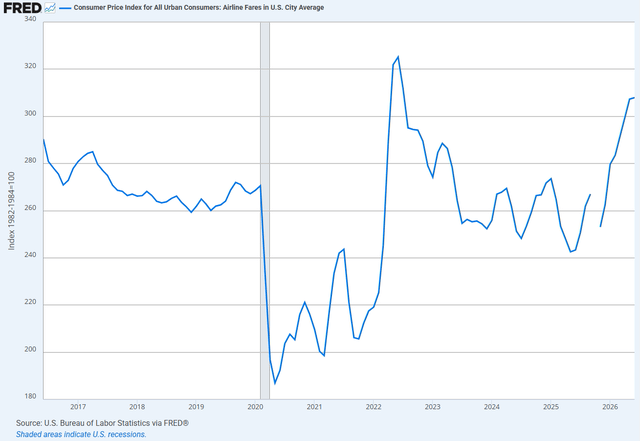
Granted, the weight of airline fares in the CPI is only 1.1%. In core CPI, airfares account for only 1.4% of the total basket. But anyone who did book a flight recently has likely needed to cut back on other forms of spending.
That puts downward pressure on other parts of the CPI basket.
We think it is telling that the share of CPI items with price growth over 2.5% collapsed in June, and even its 6-month moving average appears to have rolled over.
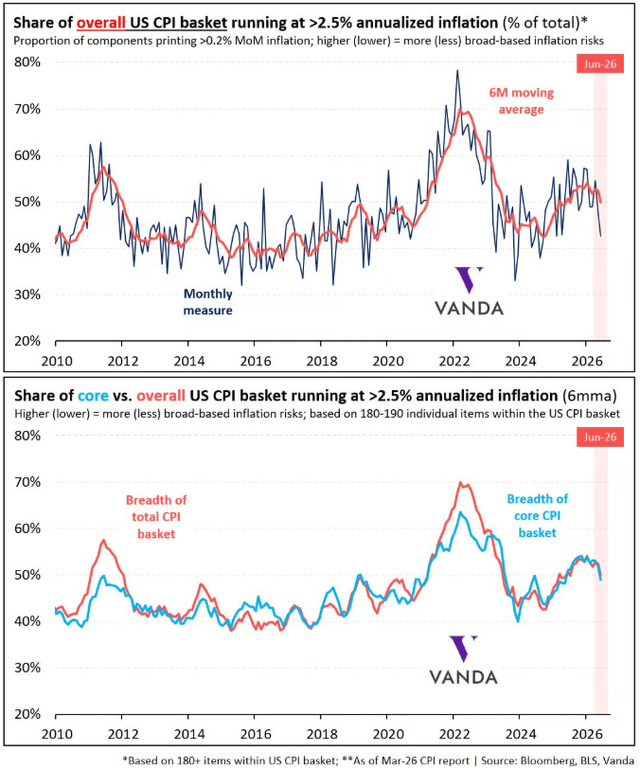
This, we think, is another sign that higher prices at the pump are forcing consumers to cut back elsewhere, which ultimately translates into lower prices in those other areas.
Another obvious area where consumers are likely cutting back is restaurants.
While “Food At Home” (grocery) inflation remains steady at about 2.5% YoY, “Food Away From Home” (restaurant) inflation has been sliding this year.
Food At Home (Blue) & Food Away From Home (Green) YoY:
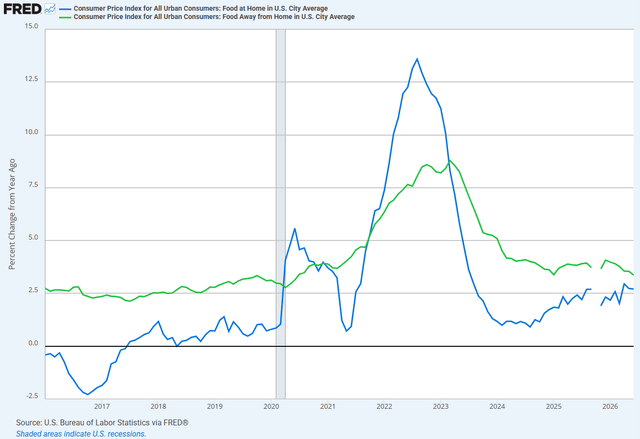
Restaurant price growth has now reached a post-COVID low of 3.4%.
That’s still higher than its ~2.5% average level during the 2010s, but the trajectory seems clearly downward, not upward or even sideways.
