



The October CPI report came out recently, and the market seemed disturbed by it. The 10-year Treasury yield jumped back above 5% in response.
In previous months’ inflation reports here at High Yield Landlord, we have demonstrated how the CPI’s rebound has been almost entirely driven by oil prices. As such, when oil prices fall, so also will the CPI. And when the CPI falls, so also will long-term interest rates.
Lower long-term interest rates should translate into better returns for REITs.
But this CPI report for the month of October is a unique one, for multiple reasons. First, it lacks year-over-year data due to the government shutdown in October 2025. That makes it a bit more challenging to analyze the results. Second, it shows a month-over-month increase in the prices of a wide variety of other items, especially food.
Unfortunately, it looks like high petroleum prices, especially diesel, have been sustained long enough to start filtering through into final goods.
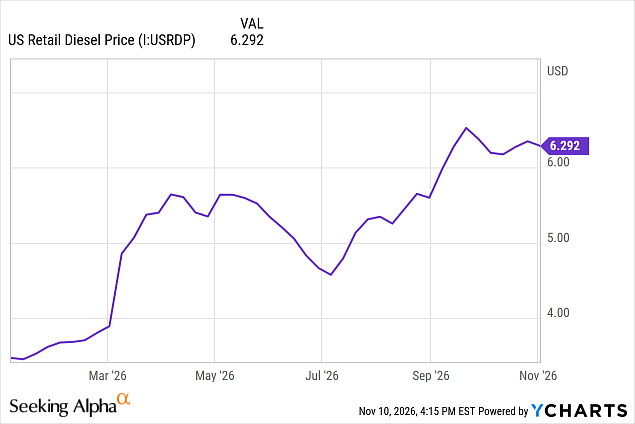
The bad news in this CPI report—and the reason rates rose in the wake of it—is that businesses are passing their higher transportation costs onto their customers.
That, in turn, pushes up long-term interest rates and raises the probability of a Fed rate hike in December.
The good news, however, is that the Big Picture disinflationary trajectory still looks intact, even if currently hitting a bump in the road. Macro factors simply don’t appear to be supportive of anything more than a temporary bounce in the CPI.
That’s why the real estate index (VNQ) regained most of its losses over the course of the day when the CPI report came out.
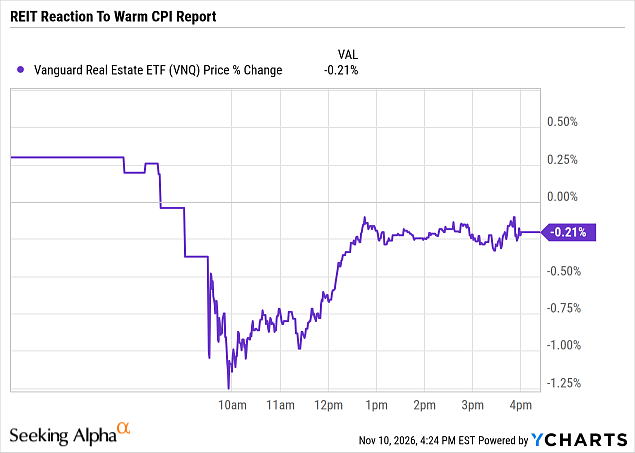
We view any price dip in REITs from this inflation report as a good buying opportunity for long-term investors.
Let’s unpack the October CPI report a little further.
An Honest Look At October CPI

The CPI has risen at a year-over-year pace over 2% every single month since February 2021. That’s five and a half years spent above the Fed’s 2% inflation target.
In the second half of 2025 and into the early months of 2026, it looked like the tariff-induced price increases had subsided, facilitating a return to the disinflationary trend from 2023-2024. Then the military conflict in the Middle East began in the Spring of 2026, resulting in a sharp spike in energy prices.
If the market perceived an impending end to this conflict, businesses would likely eat the short-term energy costs rather than raise their own prices. But as the conflict has persisted, it has become clear that a resolution is more elusive than initially assumed. Thus, businesses have become increasingly inclined toward passing through energy-related input costs to their own customers.
Using estimated October 2025 data, here’s a chart of headline and core CPI:
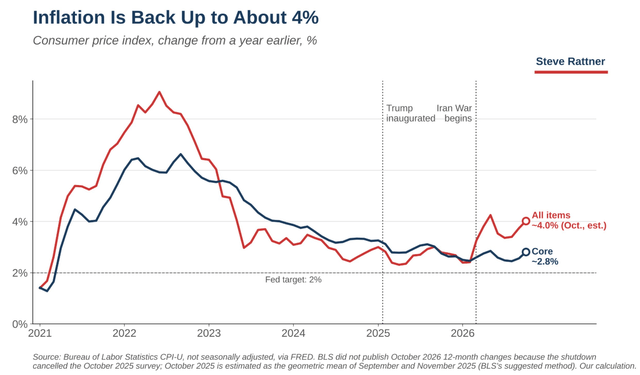
Headline CPI increased from September 2026’s 3.7% to October 2026’s ~4%, which is moving in the wrong direction but is a lower rise than expected.
Meanwhile, core CPI (excluding food & energy) also rebounded slightly to 2.8%, up from 2.6% in the previous month.
To be clear, a 2.8% core CPI reading is not terribly worrisome on its own, especially compared to the 5%+ core CPI increases in 2022 and 2023.
But there are some concerning points when you look under the hood.
For example, the share of CPI components rising at a higher-than-2% YoY pace surged from around 60% a few months ago to 76% in October.
Percentage of CPI Components Rising Faster Than 2%:
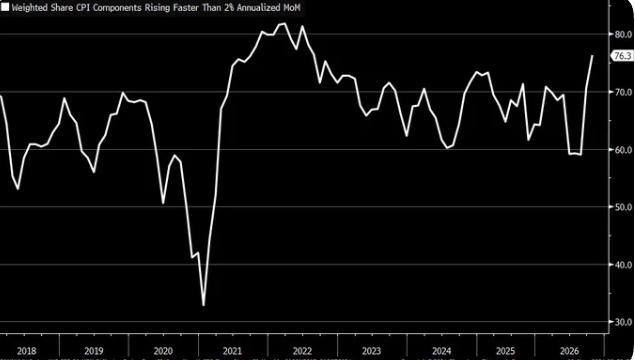
That marks the largest portion of items above 2% since the first half of 2022.
While tariffs and heavy AI investment spending play a role in this widespread inflation, the primary culprit is the cost of energy for transportation.
Looking at the major categories within the CPI, we find the broad food component (one of the most exposed to diesel prices) showing one of the most significant contributors to overall CPI growth in October.
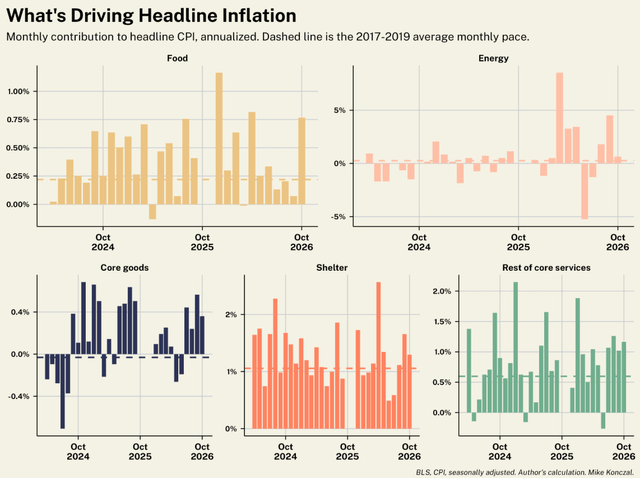
Core goods also continue to contribute to above-average CPI readings, although tariffs are also playing a role in this category.
Take a look at this interesting illustration of individual items within the CPI:
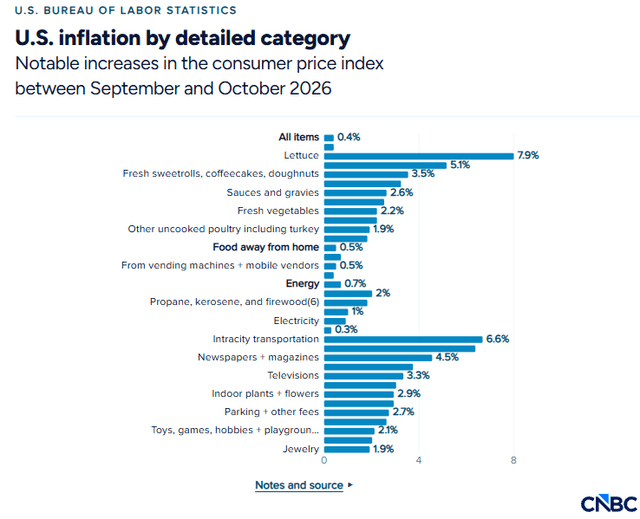
Note: This shows month-over-month increases.
Various groceries showed the biggest MoM price increases in October. Farmers and food producers can only afford to hold off on price increases for so long when their own input costs are high. Notably, restaurants barely nudged up aggregate prices in October, but given higher food costs, they will likely pass through these costs to their customers at some point.
Notice also that “intracity transportation” surged 6.6% MoM. That is because many city buses run on diesel.
Put simply, diesel is one of those critical input costs that heavily influence downstream goods and services.
A variety of factors have contributed to the upward trajectory in the producer price index over the last several years, and surely diesel is one of the most significant this year.
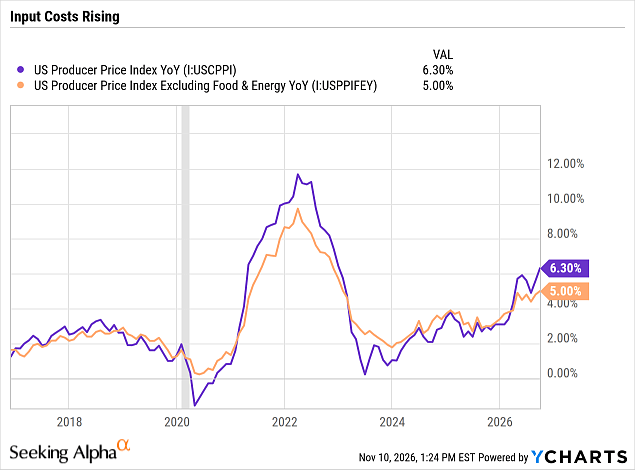
Unfortunately, the Middle East conflict has lasted long enough at this point to make cost pass-throughs inevitable.
October was likely just the beginning of a multi-month pass-through of these higher energy costs.
