


This year, the 10-year Treasury rate has surged 50 basis points from around 4.2% at the start of the year to ~4.7% as of mid-August.
It would be tempting to think that the current dip in the REIT index has something to do with that.
We do not think it does.
Instead, we think REITs basically trade like “anti-AI” stocks this year. In April and May, REITs (VNQ) flatlined as technology stocks (XLK) surged to a new all-time high. At the beginning of June, tech peaked at the same time as REITs troughed.
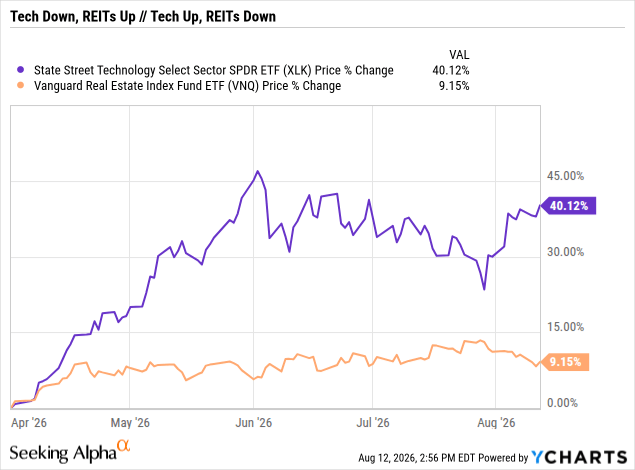
Then from June through late July, REITs rallied while tech slid. In late July, REITs peaked at the same time as tech troughed.
So far in August, the trend appears to have reversed yet again, sending REITs lower and tech higher.
While frustrating for the REITs themselves, we see a silver lining here. While broad-based stock market indices grow increasingly tied to the AI trend, REITs are acting as a true diversifier.
For the many investors whose portfolios are directly or indirectly concentrated in AI-related stocks, REITs have never been more important to hold as a hedge.
If (when?) the AI bull run breaks down, REITs should hugely benefit as one of the primary beneficiaries of a market rotation.
But what about inflation? As we have explained in the past, REITs are among the most inflation-sensitive categories of stocks, largely because they are among the most interest rate-sensitive.
The strange thing is that long-term interest rates have diverged from inflation as measured by the CPI.
Many investors fear that elevated oil prices will trigger a much broader uptrend in inflation. That fear could be partially fueling the rise in long-term interest rates.
But for several months now, we have argued that the current spike in the CPI is overwhelmingly driven by oil and will prove temporary. The underlying disinflationary trend remains in place. The economic ingredients for a broad-based inflationary uptrend simply are not present.
Let’s dive into the latest July 2026 CPI data to explain this macro outlook.
July 2026 CPI Still Shows Disinflation
The primary drivers of above-2% inflation continue to be:
Shelter / Housing
Oil
But the more volatile of those two is oil. That’s why the huge spike in the CPI this year basically follows the price movements of WTI crude oil.
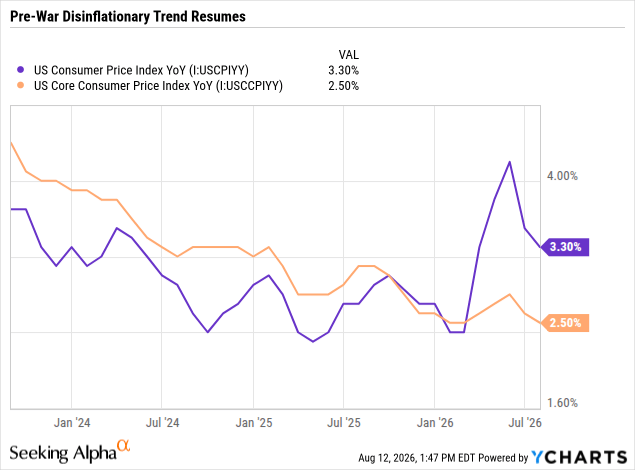
Notice from the above chart that both headline CPI and core CPI (excluding food and energy) appear to be returning to their pre-war downward trend.
Looking under the hood, we find that most components of the CPI are under control and showing no signs of rebounding.
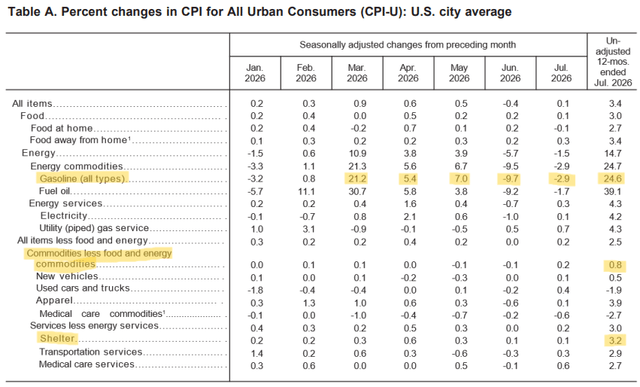
Notably, shelter and non-food/energy goods appear to be returning to disinflationary trends, as we’ll explore more below.
The biggest swing factor is oil. Note that gasoline surged 21% in March as the Iran war began, then rose another 5.4% in April and 7% in May. At that point, negotiations pushed the conflict toward de-escalation, allowing the Strait of Hormuz to gradually reopen. Gasoline prices then declined in June and July. WTI crude oil may have rebounded somewhat in July, but so far gasoline prices (at the pump) have only inflected slightly higher.
We still think inflation has peaked and will be lower by the end of the year.
Cost-Side Pressures Are Limited
Inflationary pressure can basically come from two angles: The input cost side or the consumer/customer demand side.
Cost-push inflation is when input costs have sustainably risen, forcing businesses to raise prices in order to defend their margins.
Demand-pull inflation is when too much consumer/customer money chases a limited number of goods and services, giving suppliers pricing power to raise their rates.
Higher petroleum prices are on the cost side. But oil prices are notoriously volatile, and businesses are reluctant to raise their own prices solely because of higher oil prices.
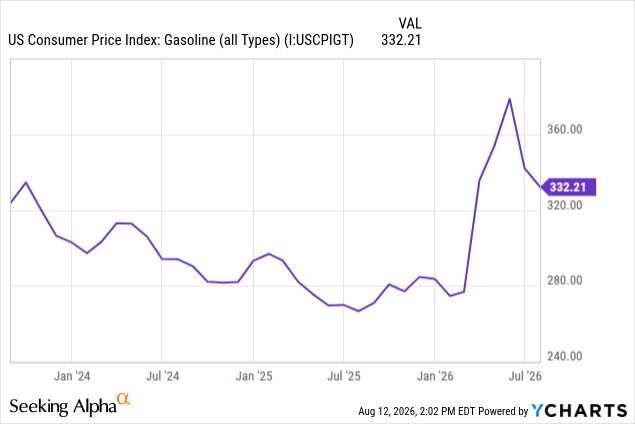
After peaking in May, the global oil market has been taking steps to shift supply chains and re-route volumes in order to minimize reliance on the Strait of Hormuz.
As such, even with the Iran conflict ongoing, both the Energy Information Administration and the futures market forecast US oil prices to continue sliding over the remainder of 2026 and into 2027.
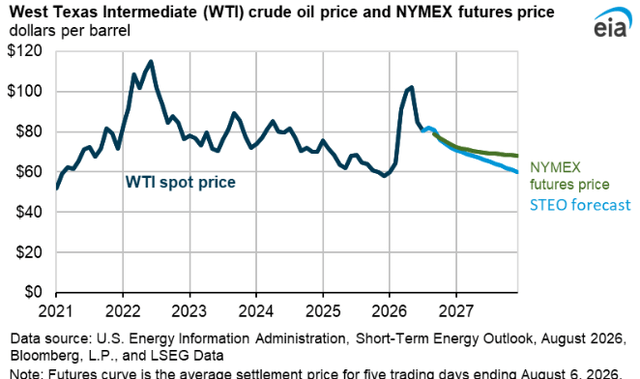
The futures market forecasts WTI crude to hover around $70 for most of 2027, while the EIA sees it falling to $60 by year-end.
The point here is that oil prices are not high enough to cause meaningful cost-push pressure, and the situation is likely to get better, not worse, over the next year or so.
What about the producer price index (”PPI”), which has bumped higher over the last 6 months
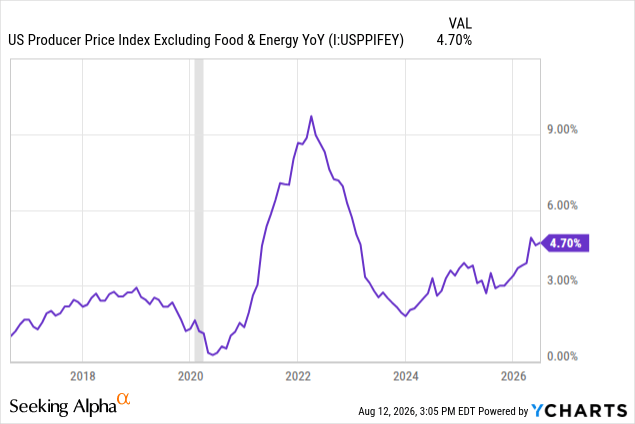
On the surface, this looks like a concerning sign of cost-push pressure.
But again, when you look under the hood, you’ll find that these input cost pressures are not broad-based at all. Instead, they are highly concentrated in AI-related technology goods.
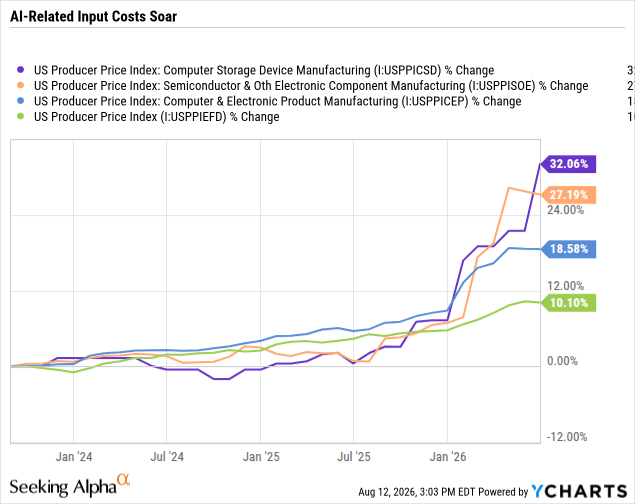
Will this cause the prices of consumer electronic products to rise? Yes. It is already doing that.
But consumer electronics make up only a tiny fraction of overall CPI.
To get a better sense of trends for the bulk of the CPI, let’s look at the biggest components: Shelter, Food, and Goods Ex. Food & Energy.
As we’ve explained in recent months’ CPI reports, the government shutdown in September-October 2025 led to a quirky bounce in shelter CPI metrics six months later in April-May 2026.
CPI Rent of Primary Residence (Blue) & Owners’ Equivalent Rent (Green) YoY:
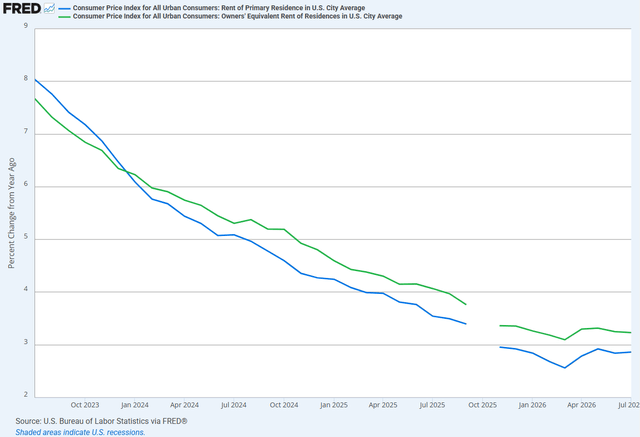
That quirk has now passed, and shelter metrics now appear to be resuming their disinflationary path.
While frustratingly slow, the government’s shelter metrics are gradually converging back to real-time rent indices compiled by private sector organizations (Apartment List and Zillow).
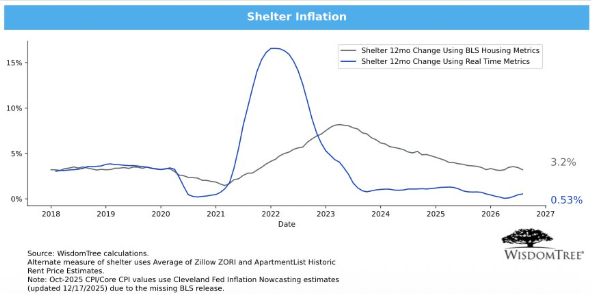
While the real-time shelter index shows an extremely low rent inflation rate of 0.53%, the CPI’s shelter metric still shows over 3% YoY growth.
Before COVID-19, these two ways of measuring shelter inflation were much closer to each other and more tightly correlated. Eventually, they should re-converge.
As that happens over time, headline and core CPI should gradually compress toward real-time inflation.
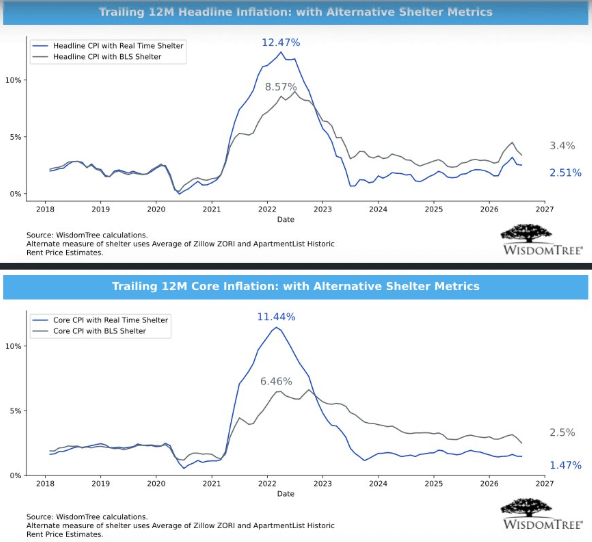

It is sobering to think about how much impact the severely lagging shelter metrics have on the CPI and, by extension, Federal Reserve monetary policy.
But the disinflationary trends are not confined to housing.
Both food at home (groceries) and food away from home (restaurants) inflation remain under control, as of July’s data.
CPI Food At Home (Blue) & Food Away From Home (Green) YoY:
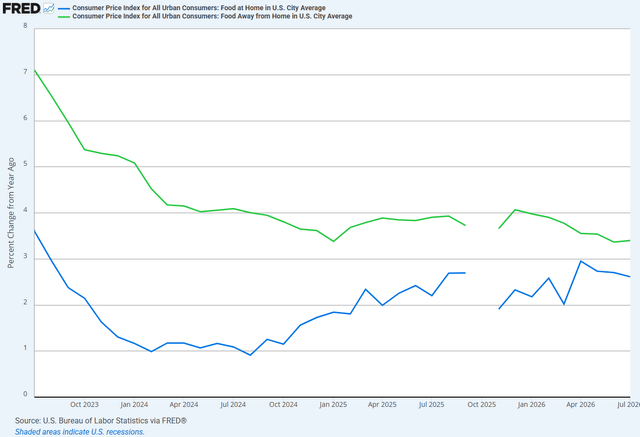
This flies in the face of the narrative that oil prices will cause prices of other goods, like food, to rise. Prices do continue to creep up, but not at a faster rate than before the war began (if you combine both groceries and restaurants).
Next let’s look at “commodities less food and energy commodities,” which is basically tantamount to all other goods besides food and energy. The biggest sub-components here are new and used cars, appliances, furniture, apparel, and healthcare products.
CPI Goods Excluding Food & Energy YoY:
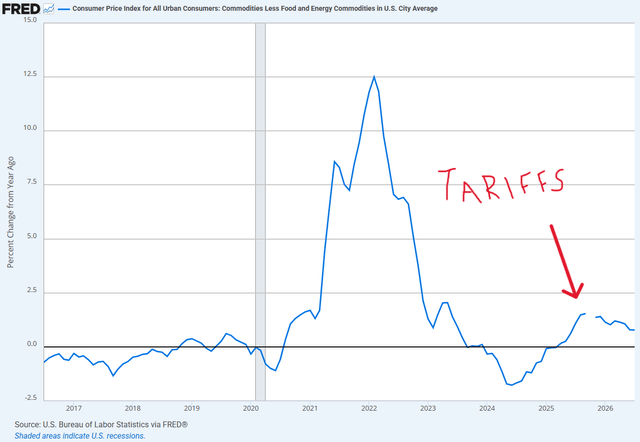
After a bump in prices in this broad category of goods in the second half of 2025, driven largely by tariff pass-through, inflation here now appears to be cooling back down.
It takes time for tariff costs to be fully passed through the final customers, and the US presidential administration has recently imposed new tariffs.
But while tariff pass-through inflation is not completely over, peak pressures have likely passed.
Demand-Side Pressures Mostly Absent
So much for cost-push inflation. Let’s now look at the other side of the ledger: the demand side.
The biggest and most obvious source of demand-side inflationary pressure is growth in the money supply, especially when the money supply grows significantly faster than nominal GDP.
From multiple angles, current money supply growth does not seem to be contributing to demand-side inflationary pressure.
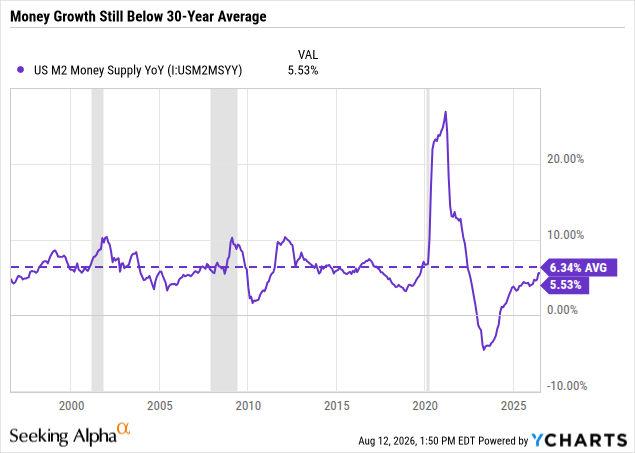
First, current money supply growth of ~5.5% YoY remains below the 30-year average growth rate of 6.3%.
Second, that money supply growth rate is also below nominal GDP growth of over 6%.
The biggest contributor to broad-based inflation is simply not a factor today.
Another major source of broad-based inflation is strong wage growth, which can cause a wage-price spiral.
After the major spike in wage growth coming out of the pandemic, US wage growth has now collapsed back to a fairly modest rate of 3.2% YoY.
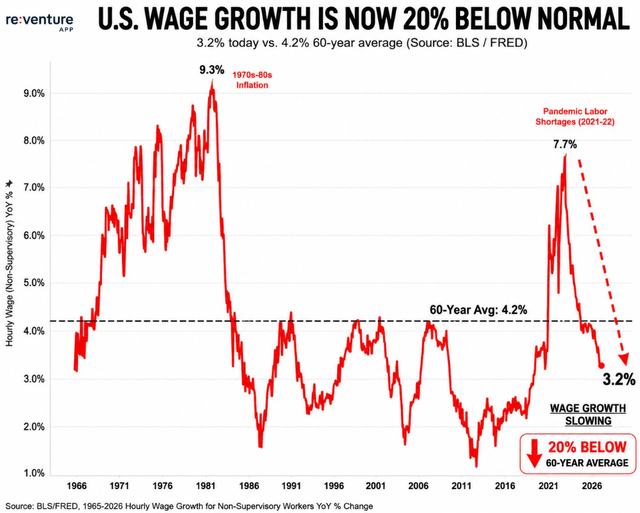
Combine this data with the (related) data on weak jobs growth over the last several months and you get very muted upward pressure on inflation from consumers.
American consumers are definitely still spending. But given limited job and wage growth, capacity to increase aggregate consumption is likewise limited.
On top of that, a very low saving rate of 2.7% is about half of the long-term average. Rarely has it gone lower than it is today.
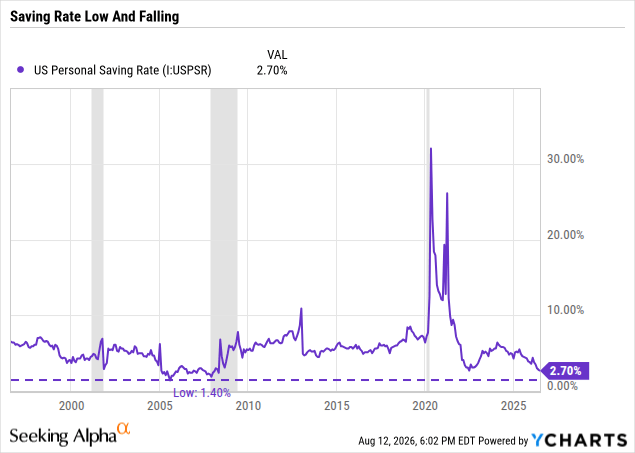
This indicates that consumers on the whole are tapped out. There is no room to increase spending, and there is little capacity to absorb price hikes.
In short, then, demand-pull inflationary pressures look extremely limited, and mostly getting weaker.
