

Rental Property And RESI: A Comparison


Rental Property And RESI: A Comparison
Note: we are currently own a small $2,000 position in RESI and expect to continue building our position in the coming weeks.

High Yield Landlord is more than just a catchy name, it is a way of investing. In all of our investments, we adopt the same mindset as an investor in physical real estate (i.e., a landlord). The only reason we invest in publicly traded REITs instead of physical real estate is simply because it affords us many additional advantages with no disadvantages, as long as we stick to our core principles as outlined in our latest portfolio update:
Buy properties at cents on the dollar via REITs trading at discounts to NAV
Focus on cash flow, not short-term price movements
Since we have no idea how share prices will perform over the next day, week, month, or year, we instead prefer to sit back and enjoy life (and the dividends!) while we wait patiently for the intrinsic value of our properties to be recognized by the market. In a world where most analysts are focused on the next quarter’s earnings, our “landlord” mindset is what differentiates us from the rest. We do not care about day-to-day performance, like owners of buy-and-hold rental properties, we rarely trade in-and-out, we do not worry about 25 basis point interest rates hikes, and most importantly, we do not fall victim to the emotional marketplace. Put simply, we are "Landlords"; not stock market "Traders".
To illustrate how we are putting this philosophy into practice in our portfolio today, and how we believe the numbers point overwhelmingly to us outperforming traditional landlords over the long run, let us look at a comparison between owning physical rental properties and the Front Yard Residential REIT (RESI) which we hold in our real money core portfolio. To read our detailed thesis, click here.
Property Type
To ensure an apples-to-apples comparison without over-complicating the illustration, we first find the typical asset found in RESI’s portfolio. As can be seen in the table below, by far the plurality of its properties are located in the Atlanta, GA area market.

Source: Company Presentation
We also know from RESI’s company filings that the company targets single family homes that are a few decades old and located in middle class communities at prices in the $150,000-$175,000 range. Average monthly rental revenue is $1,261 with average cap rates coming in between 5.5% and 5.75%.
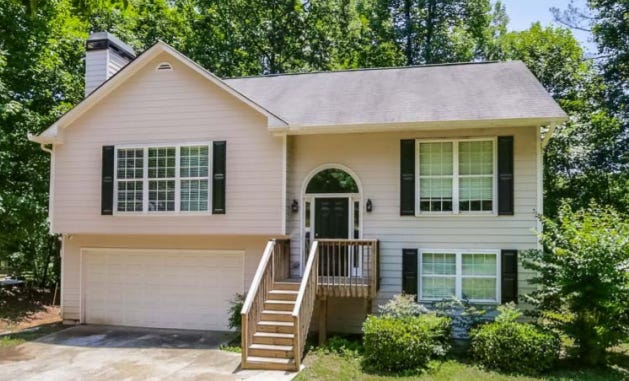
Using these assumptions, for the purpose of our comparison, let us look at the following property currently for sale on the popular single family rental investing website Roofstock:

As you can see, this home is located in the Atlanta suburbs and its monthly rent, list price, neighborhood quality, age, and cap rate all roughly equate to the typical home found in RESI’s portfolio. One of the nice things about Roofstock is that it provides the current financial estimates for the property based on the home inspection and current data provided from its partner property management companies. This will enable us to make more accurate assumptions about the expected profitability from this property for comparison purposes to an equivalent investment in RESI.
Next, we need to know how much leverage to apply to the property in order to make an accurate comparison with RESI. Using expected end of year (2019) numbers, RESI is expected to have ~$1.75 billion in debt, ~53.6 million shares, and generate $161.5 million of NOI. Using a 5.6% cap rate, this equates to a total NAV of ~$1.13 billion or ~$21 per share. However, since the average home in RESI’s portfolio is older than this house (though many are this age or younger and this NAV figure has actually been verified by numerous research firms and investment banks), for the sake of being conservative, let’s assume a 6% cap rate. This would yield a NAV of $0.95 billion or ~$17.6 per share. As a result, for our analysis we will assume a leverage ratio of 1.75 parts debt for every 0.95 parts equity (i.e., ~35% equity).
Finally, we will assume the usage of a property manager for the rental property (since landlording without one takes a lot of extra time and effort which is difficult to quantify in dollar terms) and a 4.75% interest-only balloon payment loan on the property (since that is how much of the financing that RESI uses is structured).
Step 1: Initial Investment
Using the 35% down payment assumption and accounting for the expected closing costs and immediate expenses, it would require a traditional landlord to make an initial investment of $60,740 in order to get 35% equity in a $160,000 home.
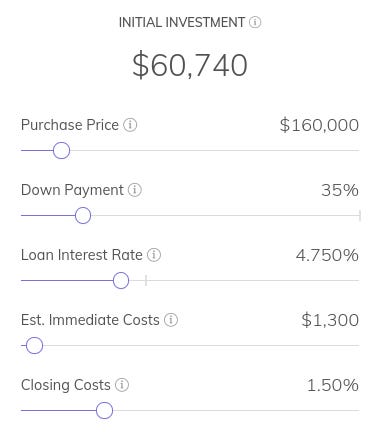
In contrast, at RESI’s current share price of $9.75 and NAV/share of $17.6, you would get 35% equity in such a home for holding 3,182 shares of stock at an investment of $31,022.73. That means, by investing in RESI, you get close to a 50% discount on your investment immediately! Not only that, but you can purchase these shares with a few clicks of the mouse from the comfort of your own home rather than spending hours and hours researching and visiting properties and neighborhoods, crunching numbers, arranging financing, coordinating an inspection, and closing (not to mention finding a tenant and potentially getting a property manager).
Step 2: Cash Flow
Next, we will examine how RESI’s model compares to owning a physical investment property in terms of cash flow. RESI is forecast to generate NOI at a run rate of $161.5 million at year-end with an NOI margin of 66%. Meanwhile, our rental property is forecast to generate $8959 of NOI at an NOI margin of 64.4%. Translating this to an equivalent home for RESI, it would generate $9582. This discrepancy makes sense, however, given that RESI is integrating its own internal property management operation this year and has tremendous economies of scale which give it a cost advantage here in addition to pricing power in negotiating insurance and maintenance/repair costs at a more economical rate than an individual property owner could likely do.
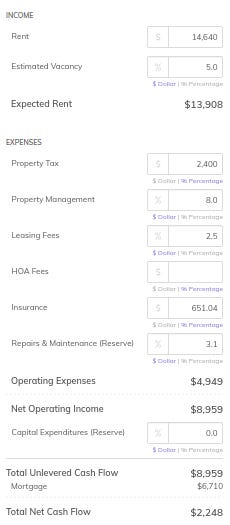
Since we will be comparing FFO from RESI to cash flow from the single family rental, we will assume a capital expenditures reserve of $0 for the rental property. We also assume a 5% vacancy rate for the property which is comparable to the ~95% occupancy rate seen in RESI’s portfolio at year-end.
Before we move forward to our comparison, we need to realize that despite achieving an NOI margin advantage due to its scale, RESI has another major expense item to deduct from its NOI that the single family rental property does not: G/A expense. Since RESI manages a vast portfolio across many markets with many employees and administrative bills, it essentially has a portfolio management company in addition to its property management operation. This is expected to add on $27 million in expenses at its run-rate by end of 2019, reducing NOI by a whopping 16.7% to $7980 for a comparable RESI home.
In reality then, RESI in its current state is not as efficient in its true NOI conversion as owning a single rental property. However, this inefficiency is something that will decline over time as RESI continues to scale (G/A is fairly fixed) and it continues to engage in cost cutting, egged on by activist investors. It is important to note that RESI’s G/A rate is much higher than peer SFR REITs due to its inferior scale. As a result, REITs - with adequate scale - can be an efficient operating structure for SFRs, though RESI has not yet achieved that level.
Given the steep discount in shares yet the inefficiency of the business model, let’s take a look at how the cash flow comparison shakes out…
At 65% leverage and a 4.75% interest rate, the interest expense is $4,940. Therefore the annual cash flow for a sample property is reduced to $3,040 for RESI and $4,019 for the individual landlord. However, remember that the initial cash investment was only $31,022.73 for RESI as opposed to $60,740 for the landlord to buy a comparable property. As a result, the cash-on-cash return for RESI investors turns out to be ~9.8% while it is only 6.6% for the landlord. Therefore, we see that even with the lower efficiencies that come with RESI’s business model, the discount to NAV is so steep that it still generates a nearly 50% greater cash-on-cash return! But that’s not all…
Step 3: Appreciation
Assuming ~3% appreciation per year over the long term for the properties, let’s see how that impacts the total returns at the current leveraged levels. 3% of $160,000 is $4800. On a $31,022.73 investment, that equates to an additional 15.5% in returns per year. On a $60,740 investment, that equates to only a 7.9% additional return per year. This often forgotten component of the total return shows just how powerful buying discounted properties can be. It is effectively bonus leverage to returns that actually builds in a margin of safety to principal rather than increasing risk and best of all, it costs zero interest!
Step 4: Total Return
Adding these steps together we see that investors in this scenario immediately get nearly $25k of free equity right off the bat ($56,000 equity minus the $31,022.73 initial investment). Furthermore, they earn a 9.8% cash-on-cash return (before CapEx) and 15.5% in long-term expected annual appreciation. Subtracting ~300 basis points from the cash-on-cash returns for CapEx, we get expected annual returns of over 22%! Additionally, the near-term returns could be much greater if the gap to NAV were to close fairly quickly. Meanwhile, the landlord still does fine, with 11.5% expected total returns over the long-term, barely over half of RESI’s annualized total return (assuming similar CapEx requirements). This assumption makes sense because, while RESI’s average property is a little older (thereby requiring more maintenance CapEx on average), it also likely acquires slightly better bargains due to its economies of scale and pricing power/market relationships (i.e., signing a contract with a roofing company to replace 100 roofs every year in a city will likely garner a better deal than an individual bargaining for just 1 roof).
Step 5: Additional Considerations
A couple other points to remember here which further tip the scales in favor of RESI are that:
(1) NAV is actually understated due to the vacancy rate. We based NAV off of the current NOI, whereas the vacant properties are obviously not generating NOI.
(2) Recall that as RESI further scales its portfolio and further chips away at unnecessary expenses, its G/A cost relative to its NOI will decline significantly. Therefore, its longer term expected annualized total returns are actually even higher than projected in this model, probably pusing closer to 25% per year.
(3) The single family rental option, while likely still outperforming the broader stock market over the long-term, will also have to deal with transaction costs on the sale end as well if the investor ever decides to sell his property. RESI’s costs, meanwhile, are already factored in to this model.
(4) Many investors will not be able to obtain an investment property interest-only loan at 4.75% interest. Instead, they will either have to get a self-amortizing loan (which forces reinvestment of a considerable amount of the monthly cash flow into paying down debt at a rate of return lower than reinvesting into additional properties), take on less leverage (also reducing long-term total returns), or pay a higher interest rate.
(5) RESI’s investment also enjoys significantly less risk thanks to diversification across thousands of properties across numerous different markets. This not only hedges against local economic downturns and lengthy vacancies, but it also hedges against bad tenants who trash the property and/or suit the landlord. Therefore, not only are the potential returns greater, but they are also safer.
Investor Takeaway
While RESI probably does warrant a discount to NAV given its current inefficiencies, the total passivity and the far greater safety and liquidity of the investment offset the inefficiency to a great deal. As a result, the discount to NAV should be very small. After crunching the numbers, we see that RESI at its current price is ridiculously cheap. Even if management falls short of achieving its end-of-year goals and only returns a 0% cash-on-cash return after CapEx (i.e., free cash flow return), when combined with the 15.5% long-term expected appreciation returns on equity, RESI is still poised to significantly outperform owning individual rental properties. Therefore, the investment possesses a wide margin of safety.
The main risk to the thesis is that the single family home market will experience declines and/or flatten out over the long-term. While this is always possible, and we do not know what the near term holds, we feel confident that, due to the economic vibrancy and growth in RESI’s primary markets such as Atlanta, Memphis, and Dallas-Fort Worth, the affordability of these properties in these markets as opposed to other large cities across the nation, and the long-term popularity of the single family home for American households, the portfolio will continue to appreciate in value. Accordingly, while the short term outlook for the share price may be volatile and uncertain, the long-term safety of principal remains quite strong. While some might view RESI as a high-risk small cap stock, we view it as a professionally managed portfolio of thousands of single family homes spread across several vibrant markets trading at a steep discount and that over the long term possesses a significant degree of safety and high total return potential.
Good investing from your HYL Research Team,
Jussi Askola & Samuel Smith

Disclaimer: High Yield Landlord® ('HYL') is managed by Leonberg Capital - All rights are reserved. The newsletter is impersonal and does not provide individualized advice or recommendations for any specific subscriber or portfolio, as we do not have knowledge of the investor's individual circumstances. Subscribers/readers should not make any investment decision without conducting their own due diligence, and consulting their financial advisor about their specific situation.