What RPD Bought And Sold In September 2025
This is the next installment in our monthly series on the portfolio of our retired author, R Paul Drake (“RPD”). This series is mainly targeted at our retired members to give them a retiree perspective on REIT investing. If you are not a retiree, you may still find value in this series as it often discusses many of our individual holdings.
My investing is focused primarily in REITs and Energy. These are niche markets often considered treacherous by the ignorant, but also prone to mispricing, which provides opportunity.
My goal is to invest only in firms I know well through deep study. Most of my investments have been in quality companies that were undervalued in the markets. Only a small fraction have been in riskier firms where I see good potential for stronger upside.
Now for some discussion of real estate pricing.
Commercial Real Estate Pricing
One can seek to benefit by finding individual REITs whose stock price significantly undervalues the company. My favorite at the moment is Alexandria Real Estate (ARE).
One can also seek to benefit from macroeconomic developments. When interest rates and cap rates drop, REITs and other asset companies will tend to rise in price. I personally join Howard Marks in thinking that investing based on macroeconomic theses is fraught with peril.
Alternatively, one can seek to identify and benefit from broad sector mispricing when it occurs. The argument along these lines for REITs in recent years has been that public valuations were much lower than private ones, and so one should expect public REITs to catch up at some point.
Some recent data from NAREIT provides more context relative to this latter argument:
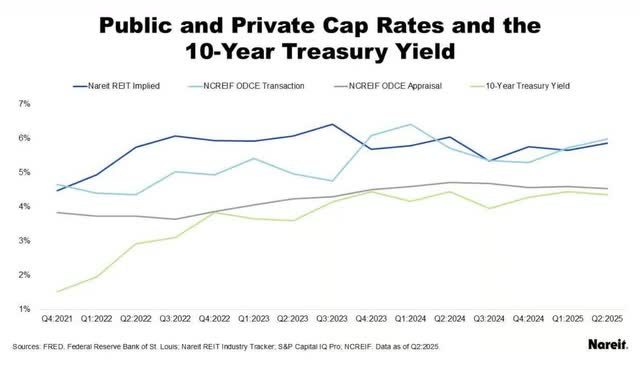
Here the US 10-year Treasury yield is in green. The dark blue curve is the market-implied cap rate from NAREIT. This is the NOI divided by the Enterprise Value. You can see that the spread to Treasury rates dropped from 300 bps at the end of 2021 to less than 200 bps since late 2023.
The other two curves relate to large, nonlisted owners of real estate. The upper, light blue curve is the “transaction cap rate,” based on actual transactions by “core funds” (big firms like Invesco and BlackRock).
The lower, grey curve is the “appraisal cap rate” for those funds, representing the value they place on those properties in their reports. The important point is that the appraisal cap rates are not based on actual property sales but rather on other ways of assessing value.
Leyla Kunimoto discusses this issue at more length in her posts, on X and LinkedIn. The important point is that that appraisal value is subjective and is subject to many assumptions even if it is not actively gamed, which can happen.
On top of that, quoting Leyla,
a fund can, for example, buy a stake in another fund at a 10% discount to NAV and mark it up to NAV on the same day. That generates an unrealized gain
This strategy keeps shareholders happy, since the alleged value of their shares keeps going up and up. And in many compensation schemes it also generates an increased payout to the General Partner, which must be paid for by new funds from investors (or dividend reinvestment).
Coming back to valuations, the implied cap rates for REITs have tracked the transaction cap rates since late 2023. On this basis, there is no systematic undervaluation.
Only if you think those markets are not giving REITs credit for the full value of future earnings would you see upside across the entire sector. For my part, I’m skeptical on the appraisal values from a system where the incentives are clearly to overstate them. What’s more, even if listed REITs should be valued at the appraisal cap rate for the privates, the corresponding increase in value would be around 25% which is not much.
As an added historical note, in 2007 Camden Property Trust (CPT) decided to aggressively buy back their stock, because private valuations were much higher than their market valuation. They aggressively added debt to do so. It took years and a significant dividend cut to recover from that mistake.
With my money, I will keep looking for REITs worth buying based on reasons other than expectations about cap rates or interest rates.
Markets this Month
It is a good moment to look back 6 months, to just before “liberation day.”
I’ve been seeing lots of trade-press coverage of green shoots in commercial real estate. In particular, the debt markets have become much more active.
My concern is that this seems to be anticipating a wave of interest-rate reductions that may or may not actually happen. The 10-year Treasury rate today is about where it was at the end of March.
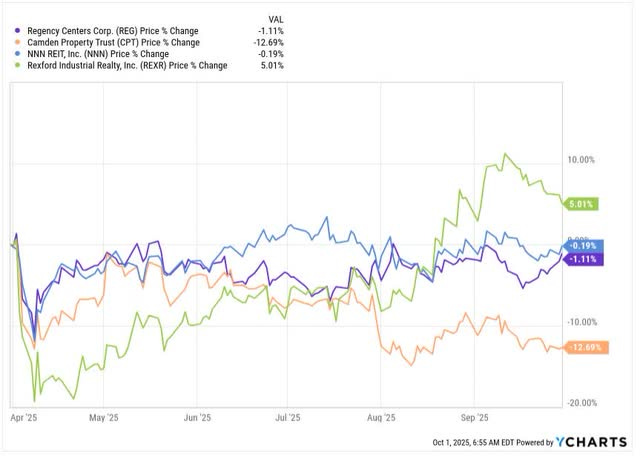
Still REIT prices have not been going crazy, rising in August and then moving sideways or down across September. Here are REITs from four primary sectors:
Although Regency Centers (REG) is the strongest of the shopping center REITs, the others I checked have similar charts. They are having good times and the markets seem to know it, even though a lot of the increased NOI will only come after tenant improvements.
In contrast, the market shows much less confidence in the multifamily sector. Camden Property Trust (CPT) is down 13% since late March. Checking a few other multifamily REITs, they show similar pricing and it is notable that prices for all of them dropped about 5% in late July around the time of Q2 earnings releases.
Apparently the sell-side analysts were disappointed by the Q2 earnings results from the sector. This is despite the fact that everybody knows that the nationwide decline in multifamily permits and starts presages great years in 2026 and 2027. If I wanted to add money to my REIT holdings today, to seek gains, the multifamily sector would be a strong contender.
The following contains updates throughout; much of it is a repeat of my last monthly update.
My Context
My secure income covers 2/3 of my spending budget. At the moment, the other third comes from various paid work.
The secure income includes social security, a pension, and a collection of annuities. Nearly all those sources have escalators of either 2% or inflation.
My dividends from “Go-Fishing” positions — very secure firms likely to grow dividends at least with inflation — also could cover more than a third of my spending. So if work stopped or when it stops, current spending is covered without drawing down the portfolio.
In the meantime I will use those dividends to grow the portfolio and to provide legacy spending. That will include some early inheritance funds to the kids each year.
The rest of the portfolio pays additional dividends (though not from all positions). These also will help grow it.
My portfolio today includes four buckets.
There is an income bucket, which includes mainly stocks with “Go Fishing” positions having extremely safe dividends. These are from firms that only need monitoring once a year, if that.
There is a “medium-risk” bucket, pursuing gains and income from market mispricing of blue-chips or other quality companies and holding high-yield positions for which I have some concerns about the dividend.
There is an upside bucket, holding small, speculative positions for which I see the potential of gains of 50% or more.
There is an illiquid bucket of long-term, private investments made years ago, valued at my cost. It stands at 13% of the portfolio value.
Most often I hold little cash. At the moment I have 1.3% in cash.
Dividends are the goal but we also know that chasing yield is a losing game. And we know that growth of portfolio market value can be a path to affording larger total dividends.


